🪙 Average Gain By Investing In Gold
🧶 Tags:: #Financial_Freedom #🌱
🔗 Links:: youngresearch
2022-12-08 - 09:40
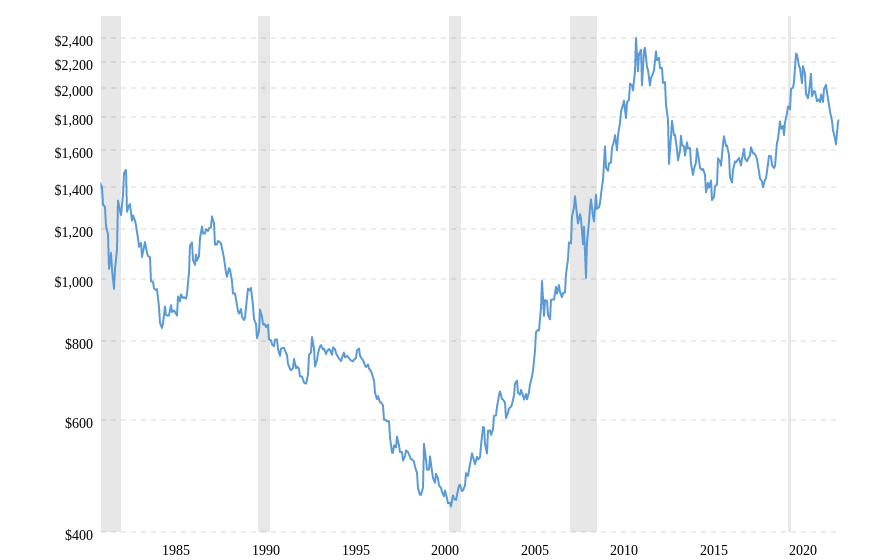
Gold Prices Over The Years (International)

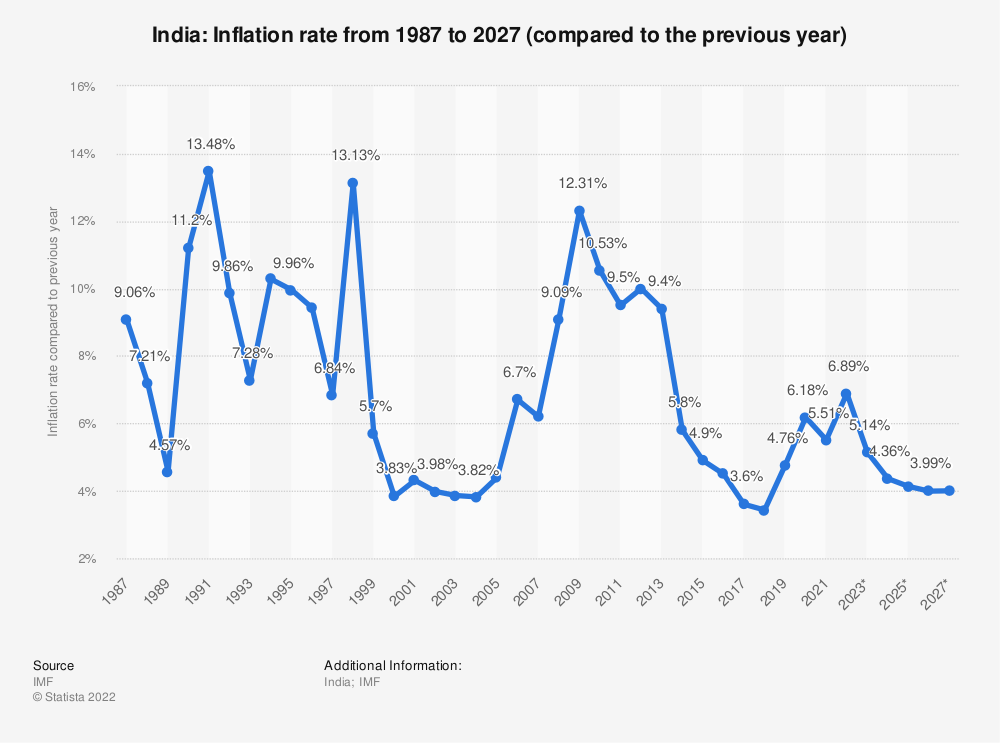
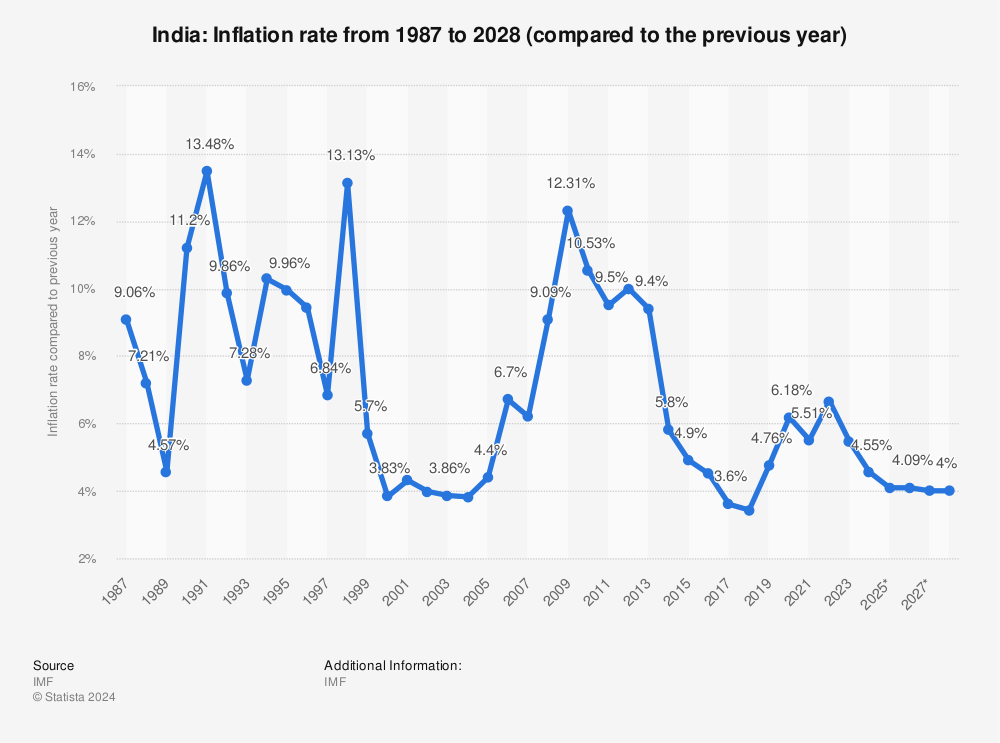
Inflation Rate In India

Embedded Chart
 Find more statistics at Statista

Gold Price In India Table
| Year | Price (24 karat per 10 grams) |
|---|---|
| 1964 | Rs.63.25 |
| 1965 | Rs.71.75 |
| 1966 | Rs.83.75 |
| 1967 | Rs.102.50 |
| 1968 | Rs.162.00 |
| 1969 | Rs.176.00 |
| 1970 | Rs.184.00 |
| 1971 | Rs.193.00 |
| 1972 | Rs.202.00 |
| 1973 | Rs.278.50 |
| 1974 | Rs.506.00 |
| 1975 | Rs.540.00 |
| 1976 | Rs.432.00 |
| 1977 | Rs.486.00 |
| 1978 | Rs.685.00 |
| 1979 | Rs.937.00 |
| 1980 | Rs.1,330.00 |
| 1981 | Rs.1,800.00 |
| 1982 | Rs.1,645.00 |
| 1983 | Rs.1,800.00 |
| 1984 | Rs.1,970.00 |
| 1985 | Rs.2,130.00 |
| 1986 | Rs.2,140.00 |
| 1987 | Rs.2,570.00 |
| 1988 | Rs.3,130.00 |
| 1989 | Rs.3,140.00 |
| 1990 | Rs.3,200.00 |
| 1991 | Rs.3,466.00 |
| 1992 | Rs.4,334.00 |
| 1993 | Rs.4,140.00 |
| 1994 | Rs.4,598.00 |
| 1995 | Rs.4,680.00 |
| 1996 | Rs.5,160.00 |
| 1997 | Rs.4,725.00 |
| 1998 | Rs.4,045.00 |
| 1999 | Rs.4,234.00 |
| 2000 | Rs.4,400.00 |
| 2001 | Rs.4,300.00 |
| 2002 | Rs.4,990.00 |
| 2003 | Rs.5,600.00 |
| 2004 | Rs.5,850.00 |
| 2005 | Rs.7,000.00 |
| 2007 | Rs.10,800.00 |
| 2008 | Rs.12,500.00 |
| 2009 | Rs.14,500.00 |
| 2010 | Rs.18,500.00 |
| 2011 | Rs.26,400.00 |
| 2012 | Rs.31,050.00 |
| 2013 | Rs.29,600.00 |
| 2014 | Rs.28,006.50 |
| 2015 | Rs.26,343.50 |
| 2016 | Rs.28,623.50 |
| 2017 | Rs.29,667.50 |
| 2018 | Rs.31,438.00 |
| 2019 | Rs.35,220.00 |
| 2020 | Rs.48,651.00 |
| 2021 | Rs.48,720.00 |
| 2022 (Till Today) | Rs.52,670.00 |
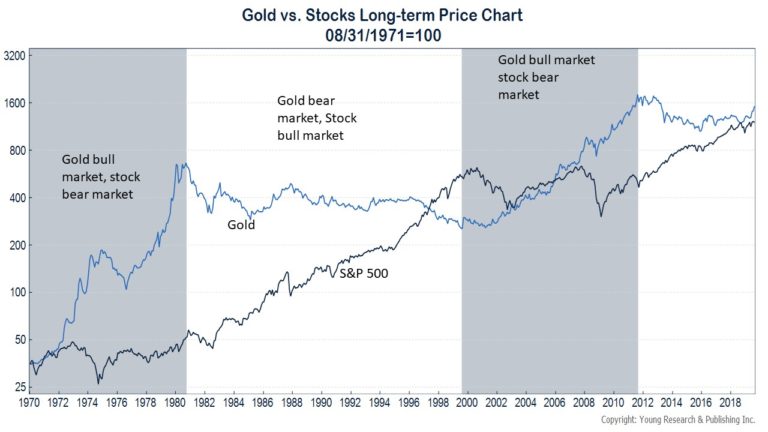
Even if we take inflation into consideration. Gold feels like a safe investment that can be used as a hedge against stock market in times of recession. But if you wanted to grow your investment betting on the stock market in the long term seems like the way to go.